
Layer settings
To change a layer, open it from the Layers list and select Settings. The settings are grouped into Layer, Time Period, Boundary, Filters and Style. Only the groups the chosen source uses are shown.
After changing the type, source, time period, boundary or filters, select Refresh to load the layer again. See Refresh a layer.
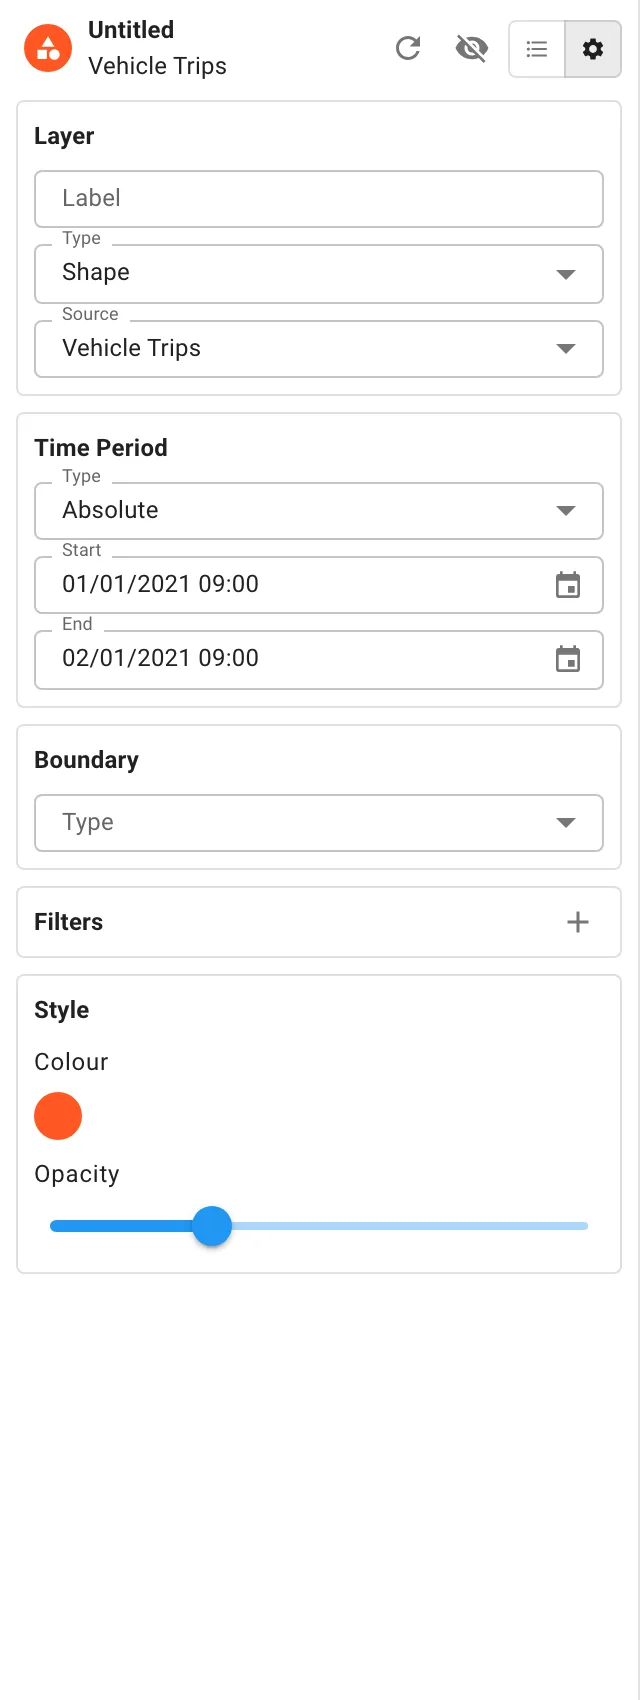
- Label: a name for the layer, up to 50 characters. It’s shown on the layer’s card and in the saved retrospectives list.
- Type: how the layer is drawn. See Layer types. Changing the type clears the source, because each type offers different sources.
- Source: what data the layer shows. See Sources.
Layer types
Section titled “Layer types”| Type | What it draws |
|---|---|
| Shape | Each item where it is: a point for a stop, a line for a trip, an outline for a location. |
| Bubble | Points grouped into bubbles, each showing how many items it holds. Select a bubble to zoom in until it splits. Close in, every item is shown on its own. |
| Heat | A heat map showing where items are most concentrated. Zoom right in and it turns into individual points that you can hover over and select. |
| Area | Areas of one type, such as wards or beats, shaded by their total for the chosen measure. Busier areas are shaded further along the layer’s colours. |
| File | The points, lines and shapes in a GeoJSON or KML file you upload. |
Area layers
Section titled “Area layers”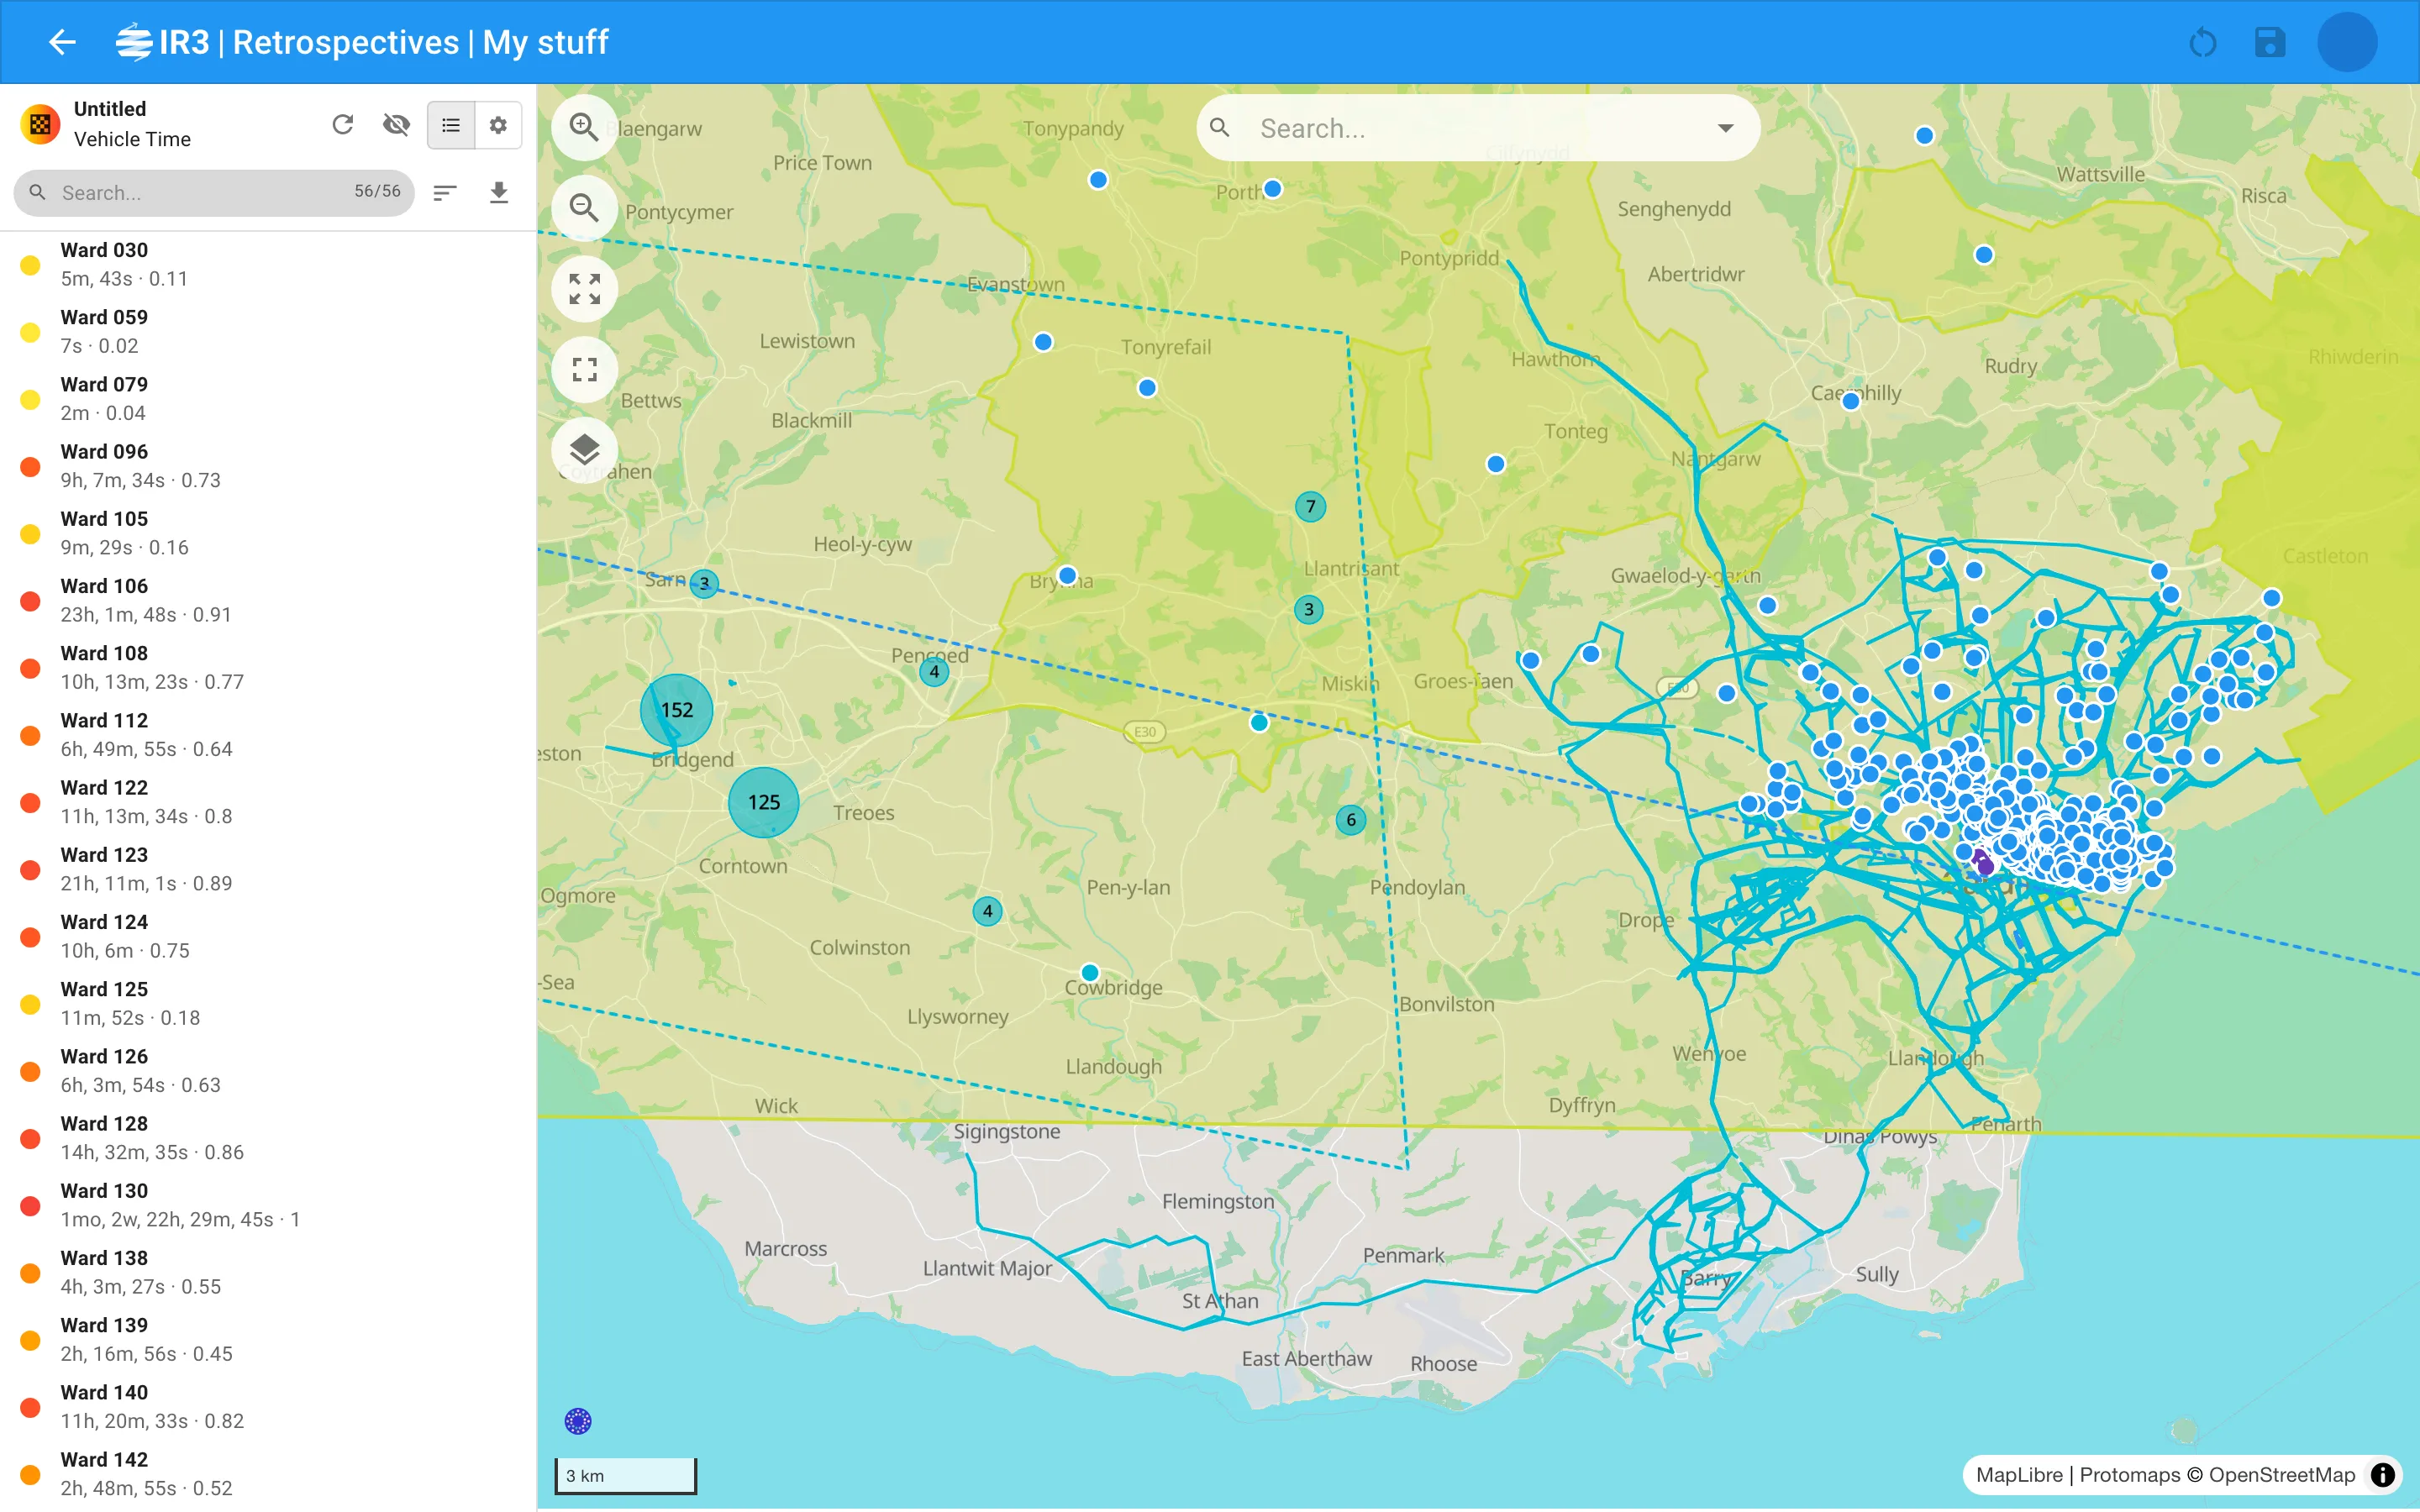
Area layers have two more settings:
- Area Type: which areas to total up, such as wards or beats. Select the Exclude untouched areas button at the end of the field to leave out areas with nothing in them. New
- Group By: optionally, combine the areas into a larger kind of group, such as sectors, and total each group instead.
Sources
Section titled “Sources”The sources on offer depend on the layer’s type. Person sources are available depending on your organisation’s set-up.
Vehicles
Section titled “Vehicles”| Source | Types | What it shows |
|---|---|---|
| Vehicle Stops | Shape, Bubble, Heat | Where vehicles stopped, and for how long. |
| Vehicle Idles | Shape, Bubble, Heat | Where vehicles idled, with their driver. |
| Vehicle Trips | Shape | Journeys, with driver, distance, top speed and use of warning equipment. |
| Vehicle Location Visits | Shape | Vehicles’ paths through IR3 locations, with the location, time spent and distance. |
| Vehicle Custom Boundary Visits | Shape | Vehicles’ visits to the layer’s boundary, and whether they parked there. Needs a boundary. |
| Vehicle Speed Infractions | Shape | Stretches driven over a speed rule, with the rules broken. |
| Accelerometer Events | Shape | Harsh driving events, with their forces. |
| Vehicle Objective Attendances New | Shape | Vehicles attending objectives, and whether each attendance met the objective. |
| Vehicle Polls | Heat | Every reported vehicle position, with speed, ignition and warning equipment. Needs a boundary. |
People
Section titled “People”| Source | Types | What it shows |
|---|---|---|
| Person Trails | Shape | Where people went, with duration. |
| Person Location Visits | Shape | People’s paths through IR3 locations, with the location, time spent and distance. |
| Person Custom Boundary Visits | Shape | People’s visits to the layer’s boundary. Needs a boundary. |
| Person Objective Attendances New | Shape | People attending objectives, and whether each attendance met the objective. |
| Person Polls | Heat | Every reported radio position. Needs a boundary. |
Incidents, locations, objectives and files
Section titled “Incidents, locations, objectives and files”| Source | Types | What it shows |
|---|---|---|
| Incidents | Shape, Bubble, Heat | Incidents open during the period, with grade, type, response and times. |
| Locations | Shape | IR3 locations in use during the period, drawn by their boundaries. |
| Objectives New | Shape | Objectives running during the period, drawn by their boundaries. |
| GeoJSON | File | The features in a GeoJSON file. |
| KML | File | The features in a KML file. |
Area measures
Section titled “Area measures”Area layers total up one of these for each area:
| Measure | What it totals |
|---|---|
| Vehicle Stop Count | Number of vehicle stops. |
| Vehicle Idle Count | Number of vehicle idles. |
| Vehicle Visit Count | Number of vehicle visits. |
| Vehicle Time | Time vehicles spent in the area. |
| Person Visit Count | Number of person visits. |
| Person Time | Time people spent in the area. |
| Incident Count | Number of incidents. |
Time Period
Section titled “Time Period”Choose the Type of period:
- Absolute: a fixed Start and End. The end must be after the start.
- Relative: a period counted back from now, such as the previous 7 days.
-
Enter a number in Duration.
-
Choose days, weeks or months at the end of the field.
-
Select the calendar button to switch between Excluding today and Including today.
- Excluding today: the period ends at the start of the current day, week or month. For example, the previous 7 days are the 7 whole days before today.
- Including today: the period runs to the end of the current day, week or month, so it includes the current one.
The button says “today” whichever unit you choose.
-
A relative period is worked out again every time the layer loads, so a saved retrospective always shows the latest period.
A layer shows everything that overlaps its period. Trips or visits may start before it or end after it. Incidents, locations and objectives that were still open or running count too.
Boundary
Section titled “Boundary”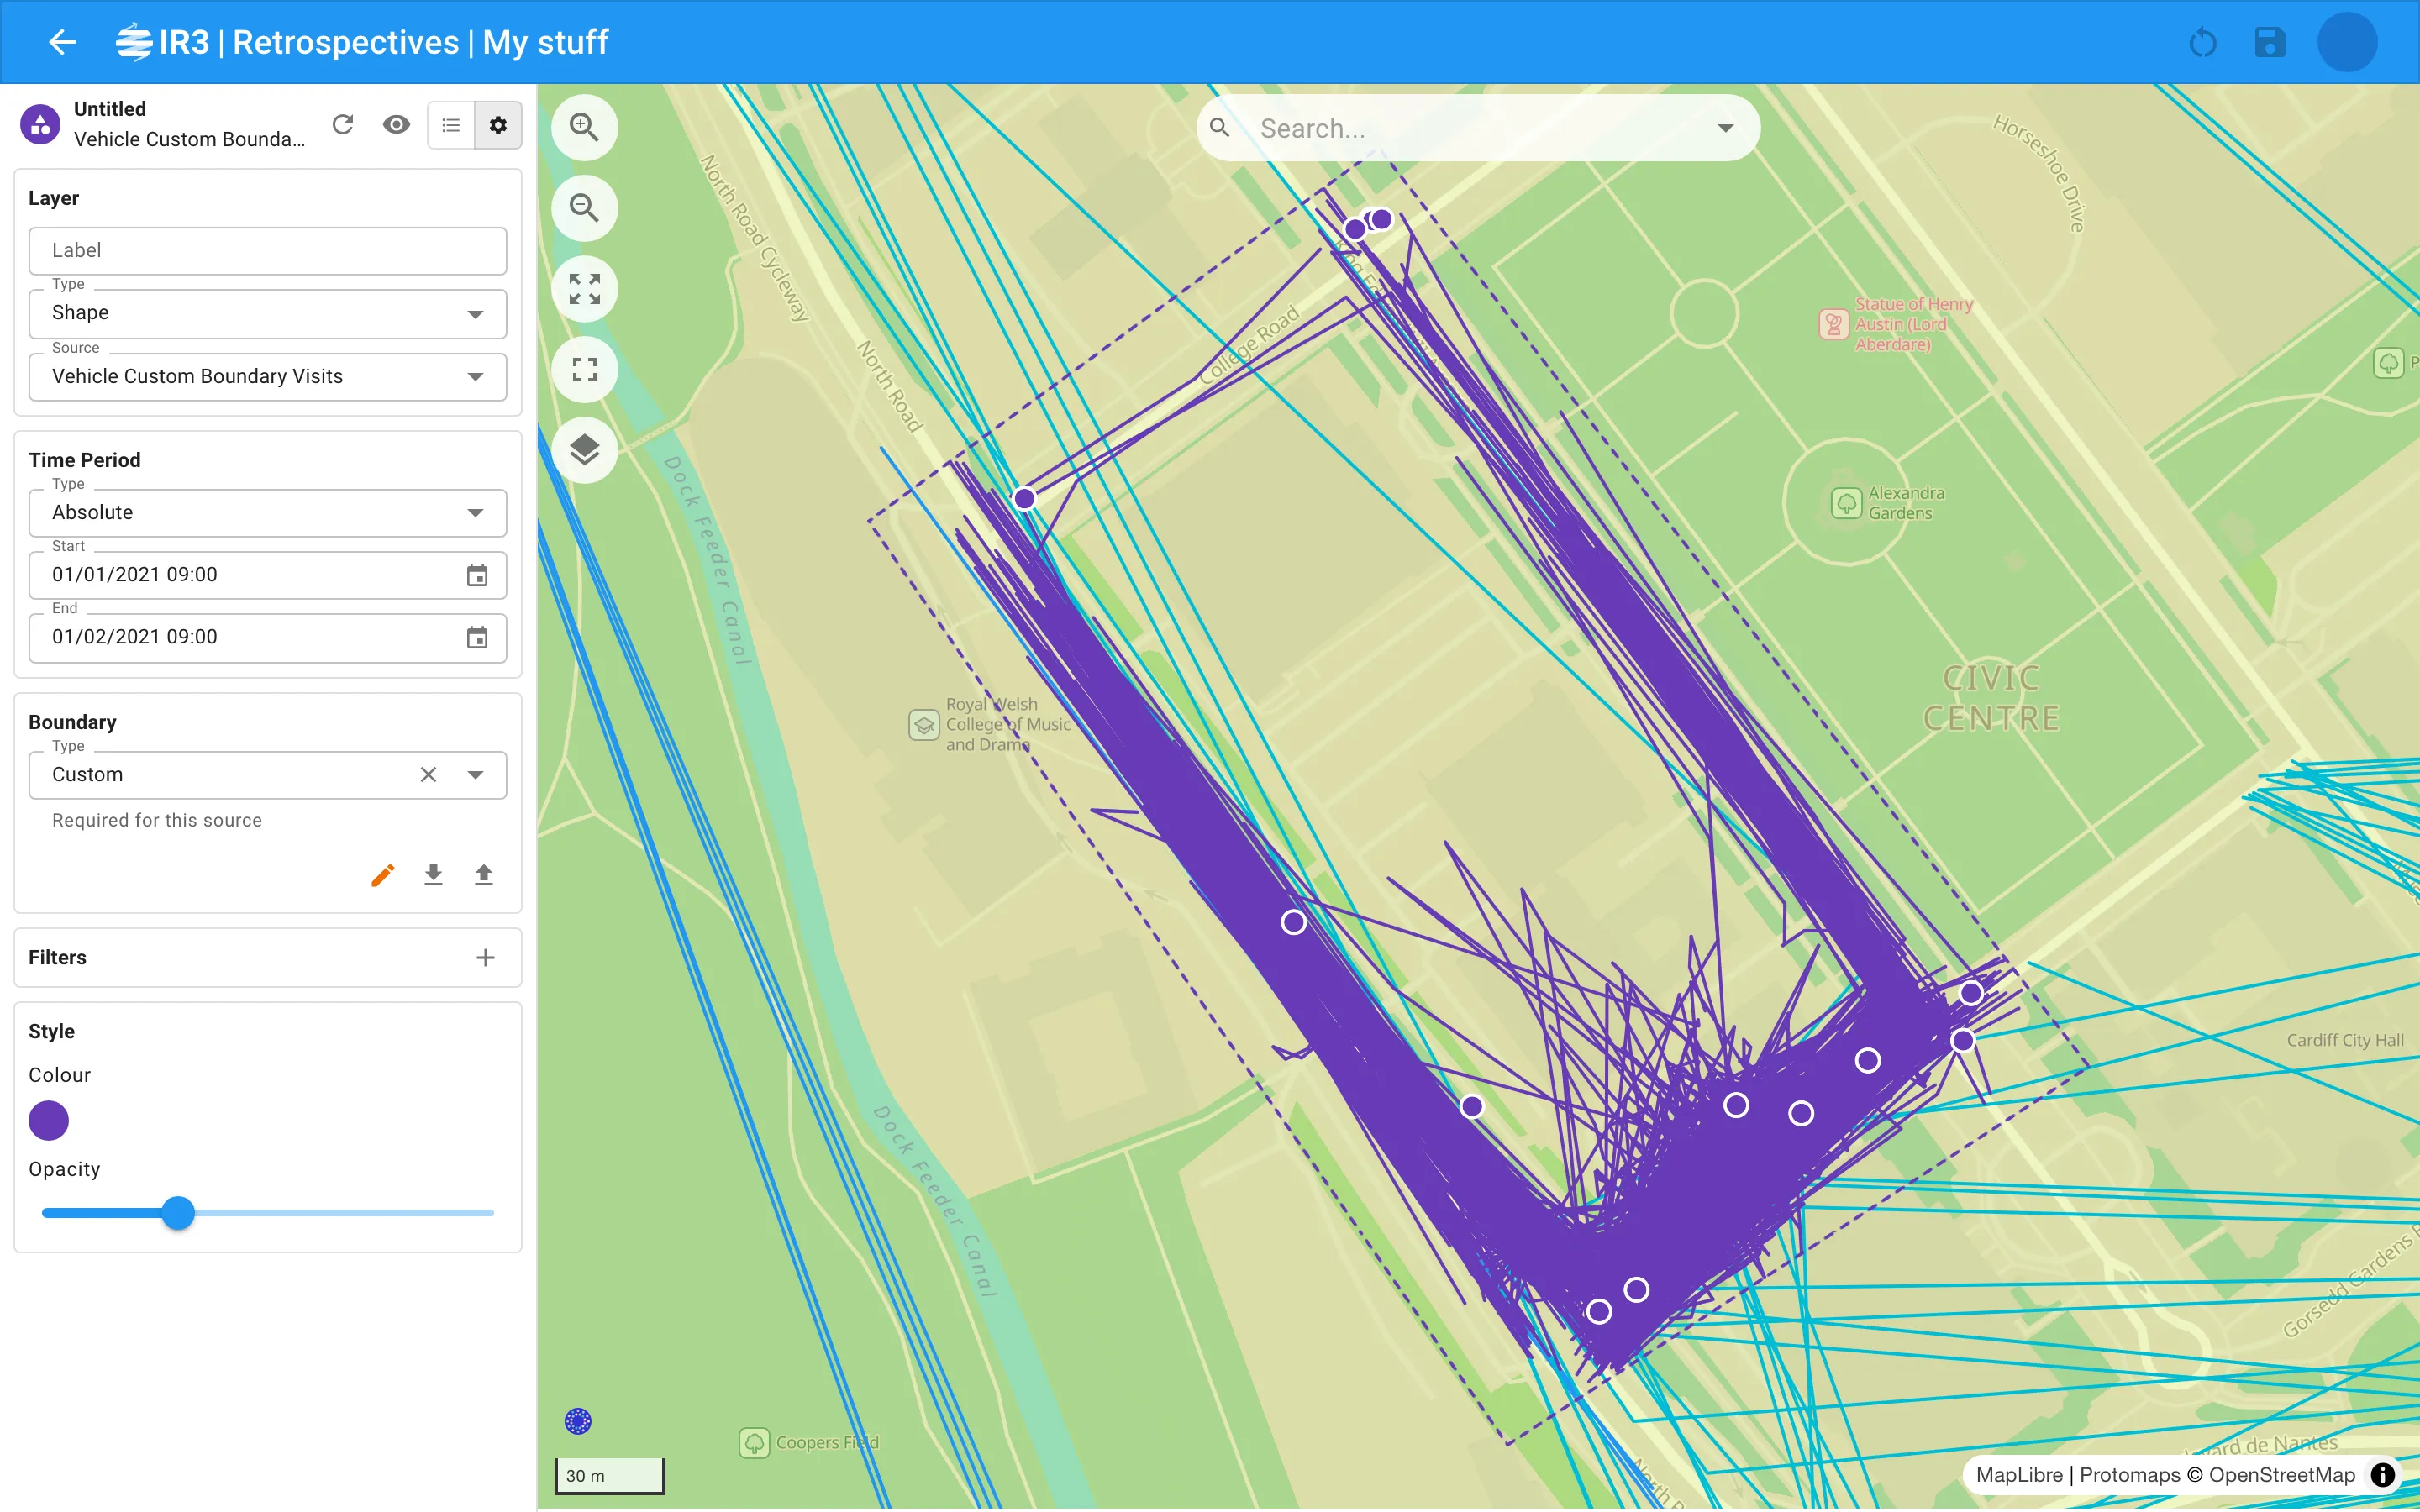
A boundary limits the layer to items that touch an area. On area layers, it also limits which areas are shown. Polls and custom boundary visits must have one.
Choose its Type, or clear the field for no boundary:
- Location: choose a Subtype, then the location’s Name.
- Objective: choose the objective’s Name.
- Custom: draw or upload your own:
- Draw (green) starts drawing a shape on the map. While you’re drawing, the button turns red as Cancel. Once you’ve drawn a boundary, it turns orange as Redraw.
- Download saves the boundary as a GeoJSON file, so you can reuse it or share it. New
- Upload loads a boundary from a GeoJSON file (
.geojsonor.json, up to 5 MB). The file must contain a polygon. New
The boundary is drawn on the map as a dotted line in the layer’s colour.
Filters
Section titled “Filters”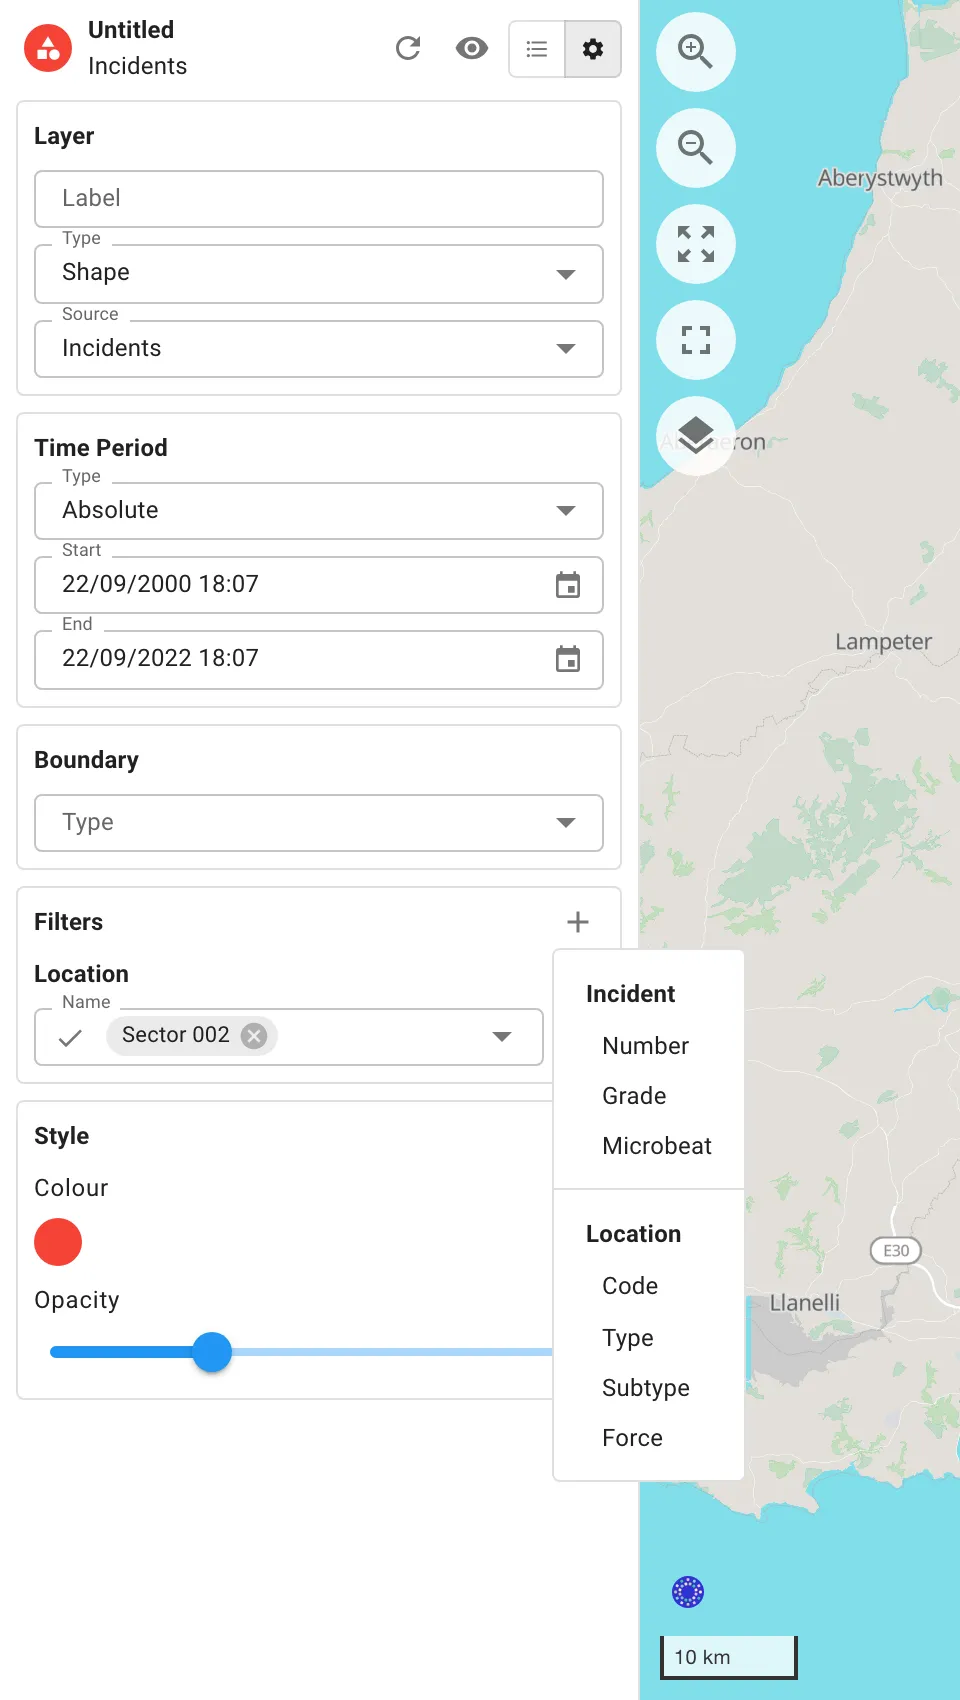
Filters narrow a layer down to particular vehicles, people, locations, objectives or incidents, or to events with particular details.
- Select Add filter (+) at the top right of Filters.
- Choose a field. The menu is grouped by what each field describes, for example Vehicle, Driver, Person, Location, Objective or Incident. The source’s own event details come last, headed with the kind of item, such as Vehicle Trip.
- Set the condition and the value.
- Select Refresh to load the layer with the filter.
To remove a filter, select the ✕ beside it.
Which fields are on offer depends on the source and on your organisation’s set-up.
Conditions for fields with a list of values
Section titled “Conditions for fields with a list of values”Select the icon at the start of the field to change the condition:
- Includes: items with any of the values you pick.
- Excludes: items without any of the values you pick.
- Any New: items where the field has a value.
- None New: items where the field is empty.
Conditions for numbers
Section titled “Conditions for numbers”Choose =, ≠, >, ≥, < or ≤, then enter the number. Durations and similar fields have a unit you can change at the end of the field.
ChangedChanges to the style apply straight away, without a refresh.
- Colour or Colours: select a colour to change it. Use the plus and minus buttons to add or remove colours.
- Shape, Bubble and File layers use one colour.
- Heat layers use up to five, running from sparse to dense. They start as blue, green, yellow, orange and red.
- Area layers use up to five, running from the quietest areas to the busiest.
- Opacity New: how solid filled shapes are. Shape and File layers start at 30%, and Area layers at 80%. Lines and points stay solid.
- Fade lower values New (Area layers): makes quieter areas more transparent. It’s on to begin with for one-colour area layers.
- Cluster distance (Bubble layers): from 4 to 10. Higher values gather points from further apart into each bubble.
- Radius (Heat layers): from 1 to 20. How far each point spreads.
- Intensity Changed (Heat layers): from 1 to 20. How strongly points add up.
File layers
Section titled “File layers”File layers show the points, lines and shapes from a file of your own. For example, you could load a file exported from another mapping tool.
- Set the layer’s Type to File, and its Source to GeoJSON or KML.
- Select Upload and choose the file. It can be up to 5 MB. Once loaded, the file’s name and number of features are shown under the button. Replace loads a different file.
- Optionally, choose a Title Field and a Subtitle Field. These are the file’s own properties used to name each item in the list and its popups.
The file is saved with the retrospective. File layers have no time period, boundary or filters.

IR3 is made by Lightbulb Analytics Ltd. © 2026