
Items
Each thing a layer finds, such as a trip, an incident or an area, is an item. You can browse items in the layer’s list or on the map, and open any one of them to see its details.
The item list
Section titled “The item list”Open a layer from the Layers list. Its Items are shown first.
Each row shows:
- a marker on the left;
- the item’s name or kind;
- when it happened, or a short summary.
Incidents show their grade, coloured by how the response compared with its target, and a chip with the incident type code. Objectives show who they apply to and a chip with their number.
Status dots
Section titled “Status dots”Many items have a coloured dot that shows their status at a glance. Hover over it to see what it means.
| Items | The dot shows |
|---|---|
| Vehicle stops and idles | Where it happened: home base, another base, a workshop or elsewhere. |
| Vehicle trips, location visits and speed infractions | Whether warning equipment was used. |
| Vehicle polls | Whether the ignition was on. |
| Vehicle custom boundary visits | Whether the vehicle parked. |
| Objective attendances | Whether the attendance met the objective. |
| Areas | How the area ranks, in its colour on the map. |
Search
Section titled “Search”Type in the search box above the list to show only items containing your text. The count shows how many match, out of how many the layer found. Searching only filters the list. It doesn’t change the layer. To change what the layer loads, use Filters.
- Select Sort beside the search box.
- Choose a field. Fields are grouped by what they describe, such as Vehicle or Driver.
To reverse the order, choose the same field again. If the field you sort by isn’t otherwise shown in the row, its value appears in a small chip at the right of each row.
Download
Section titled “Download”Select Download, then choose CSV for a spreadsheet or GeoJSON for mapping tools. The download contains the items currently in the list, in the order shown, so a search narrows it down.
Location types
Section titled “Location types”On Locations layers, chips under the search box show each type of location and how many there are. Select a chip to hide that type from the list and the map, and again to show it. These choices are saved with the retrospective.
IR3 remembers each list’s search, sort and scroll position while the retrospective is open, so you return to where you were.
Hover popups
Section titled “Hover popups”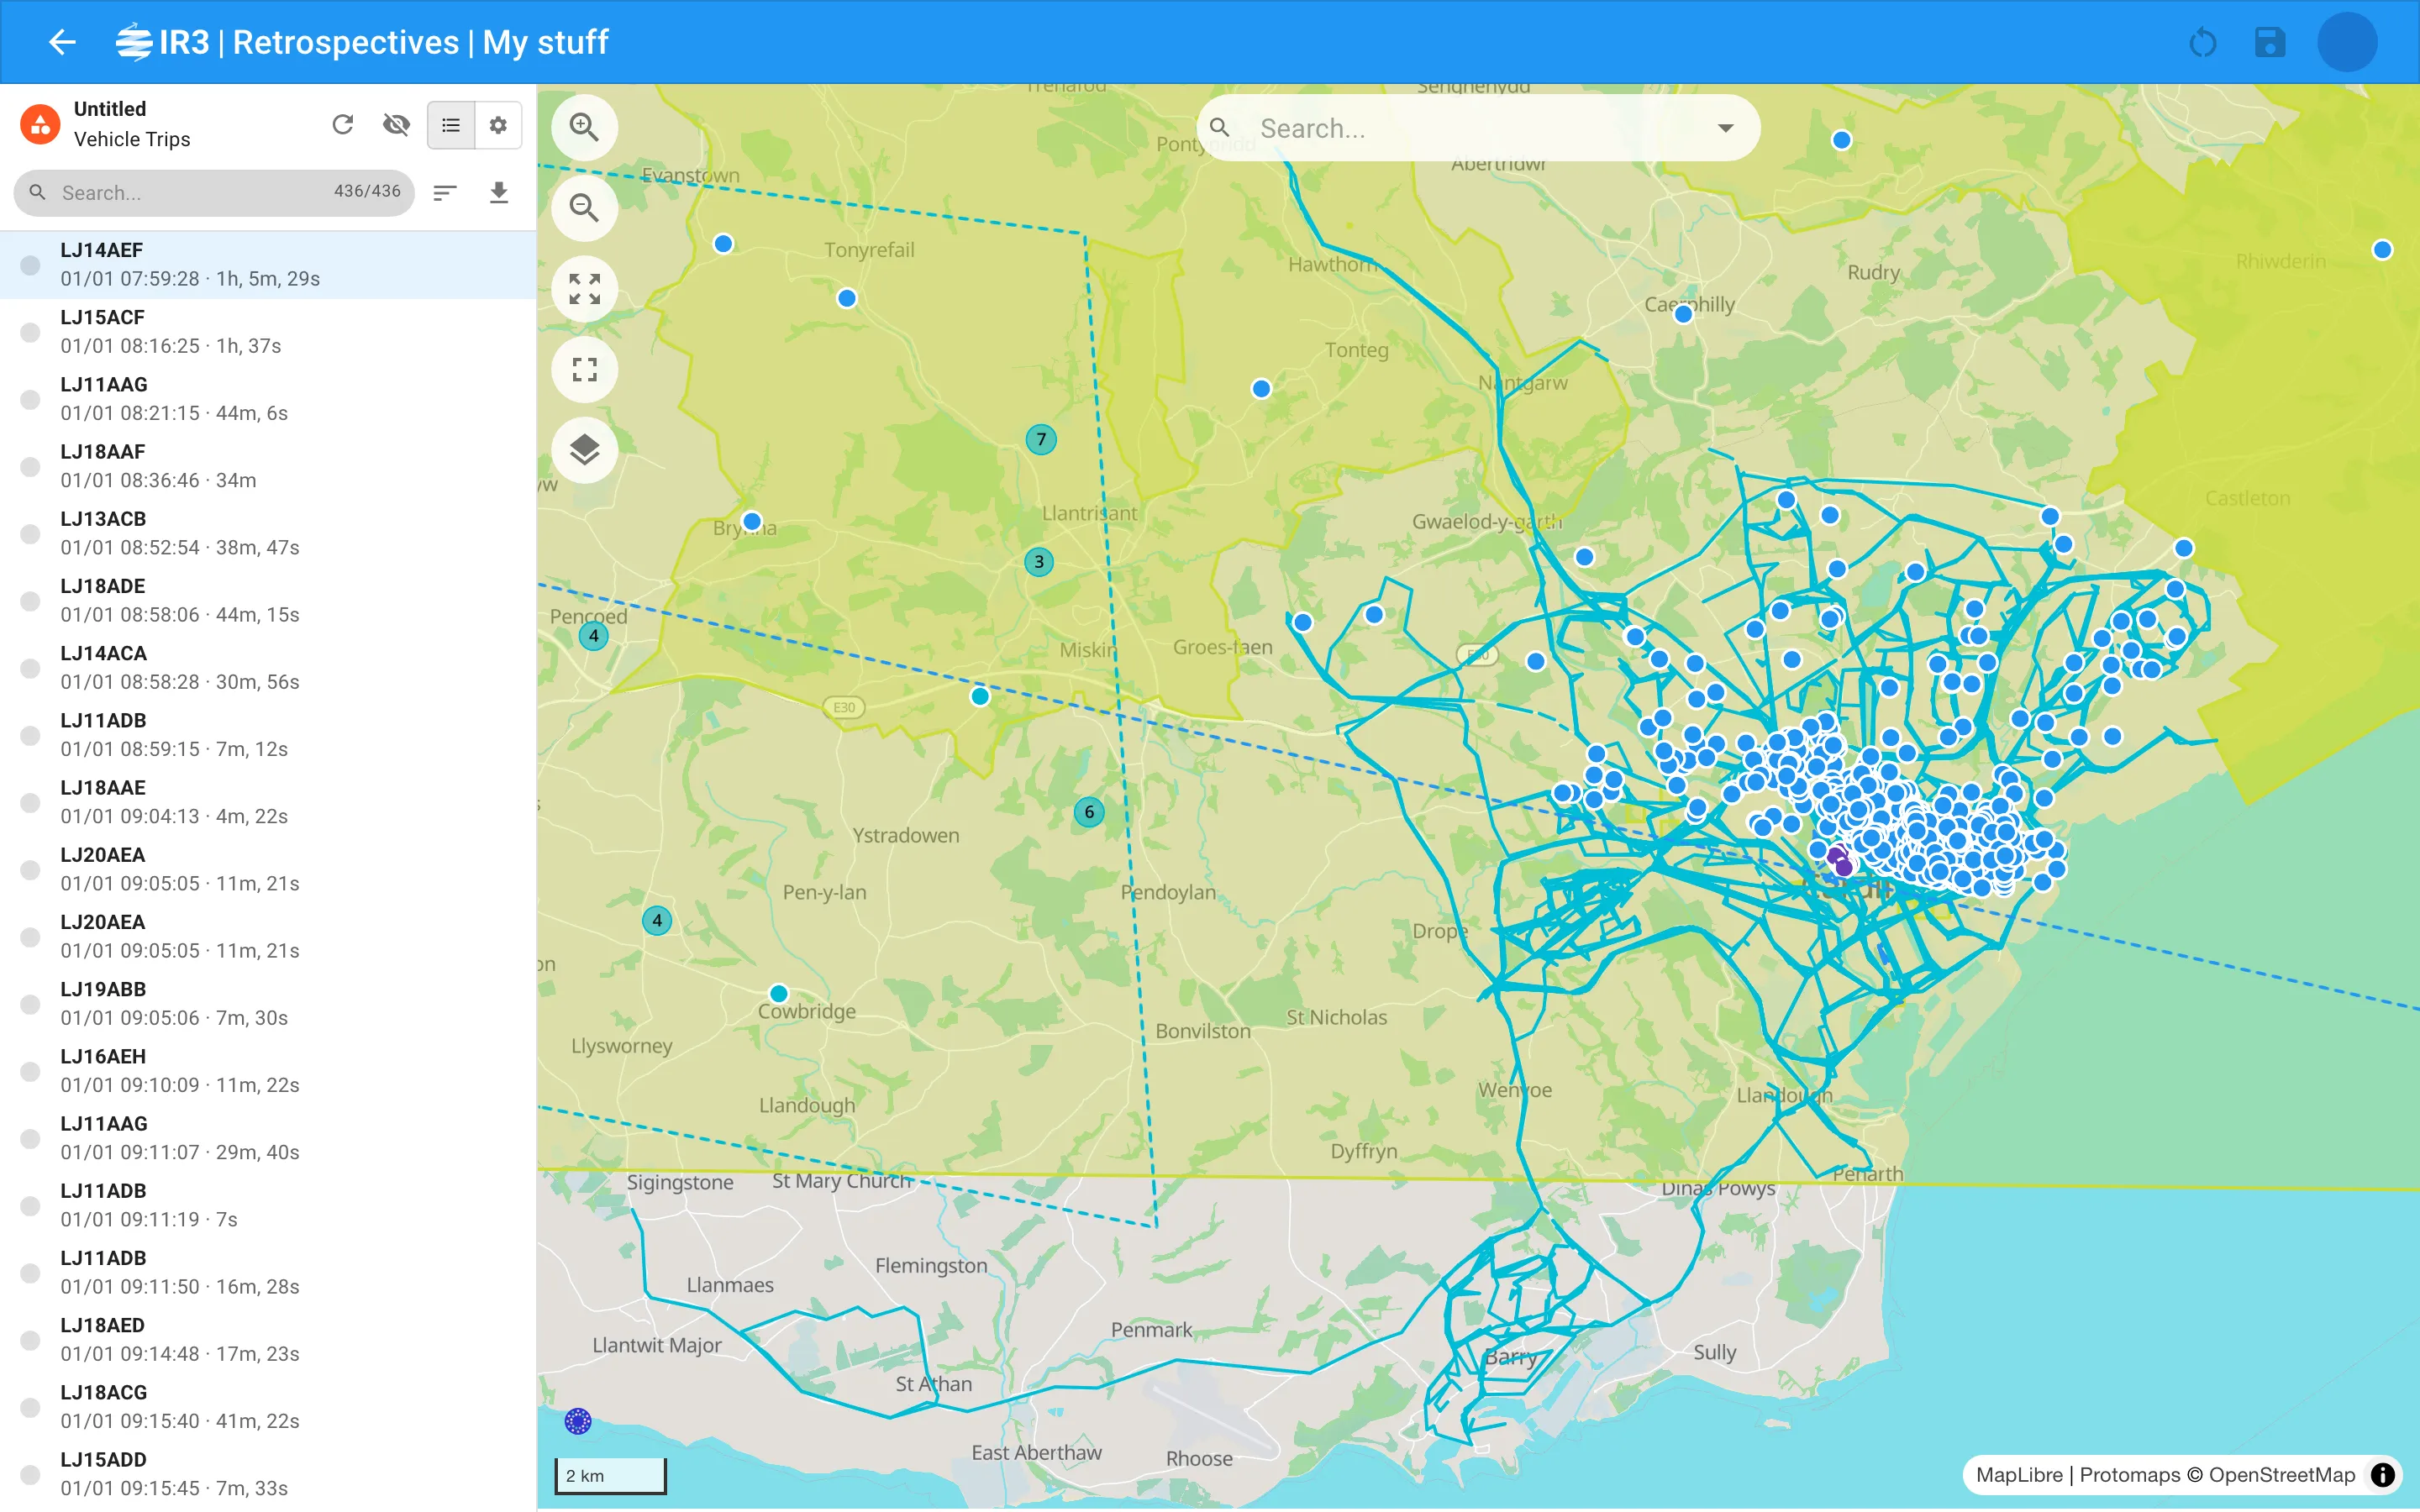
Hover over an item on the map, or a row in the list, and the item is highlighted on both straight away. After half a second, a popup shows its main details. Move on to other items and their popups show at once.
The popup stays for a moment after the pointer leaves, so you can move onto it. Incidents and objectives have the same popups as on the live map.
Bubbles
Section titled “Bubbles”On Bubble layers, each bubble shows how many items it holds. Hover over a bubble to highlight its items in the list. Select it to zoom in until it splits apart.
Open an item
Section titled “Open an item”Select a row in the list, or an item on the map. Its details replace the list in the panel. On the map, the item is picked out:
- a line is dotted black and white, with its start and end marked;
- a shape turns white with a dotted edge;
- a point turns white with a grey ring.
To close the item, select an empty part of the map or use the back arrow.
Item details
Section titled “Item details”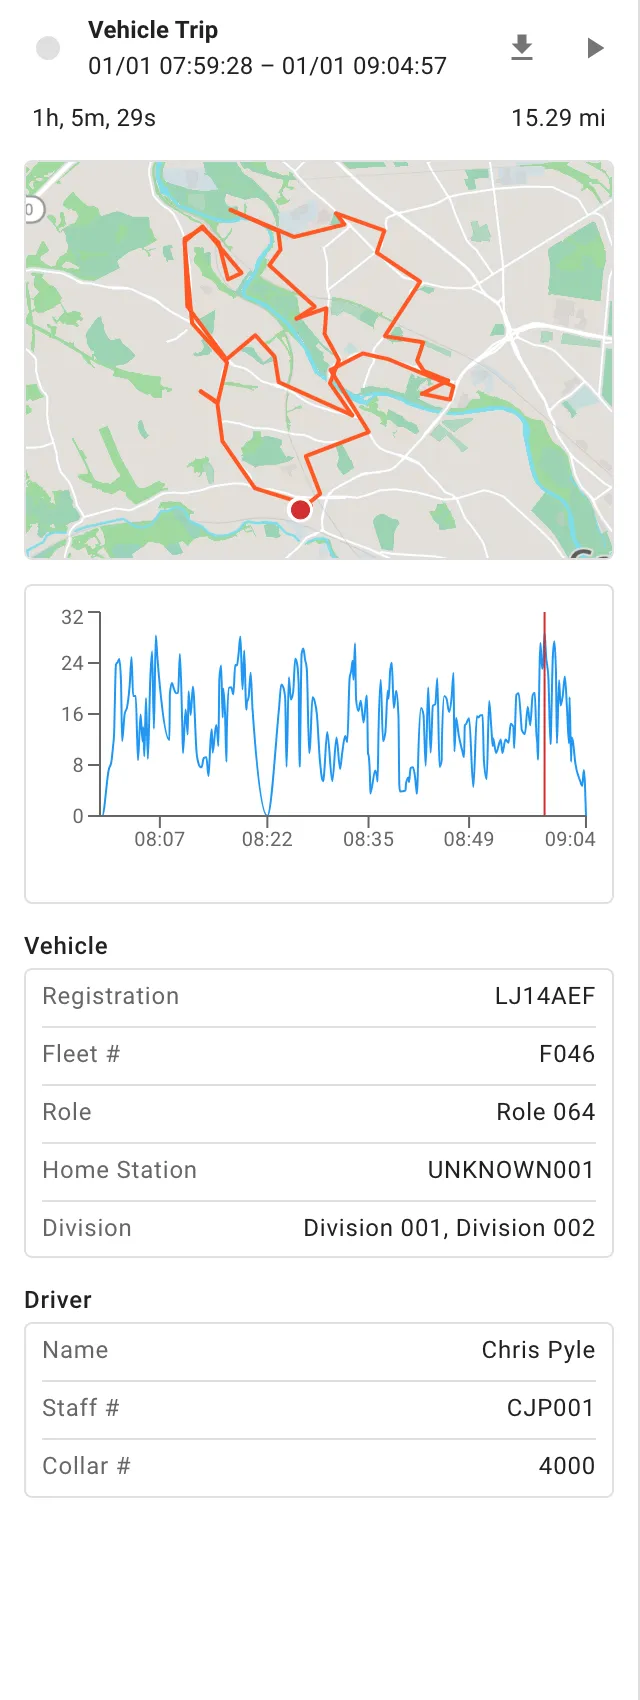
The details panel’s header shows the item’s status dot (if it has one), what it is, and when it started and ended. Depending on the item, the panel shows the following.
Duration and distance
Section titled “Duration and distance”Events show how long they lasted and how far they went, under the header.
Mini map
Section titled “Mini map”A small map shows the item in the layer’s colour:
- trips and other lines show where they started and ended;
- visits also show the location, objective or custom boundary they were to.
If you move the mini map, select Fit map to bring the item back into view.
Charts
Section titled “Charts”- Vehicle trips and speed infractions New show a speed chart against the speed limit. It also shows the g-force of any accelerometer events during the trip. Hover over the chart to see where the vehicle was at that moment on the mini map.
- Accelerometer events show their forces and speed over the event, with the second it was triggered shaded. Hovering shows the position on the mini map. A bar chart New shows the strongest force on each axis.
- Speed infractions also have a table of each speed rule broken, for each speed limit, with how long for and the top speed.
Details by kind of item
Section titled “Details by kind of item”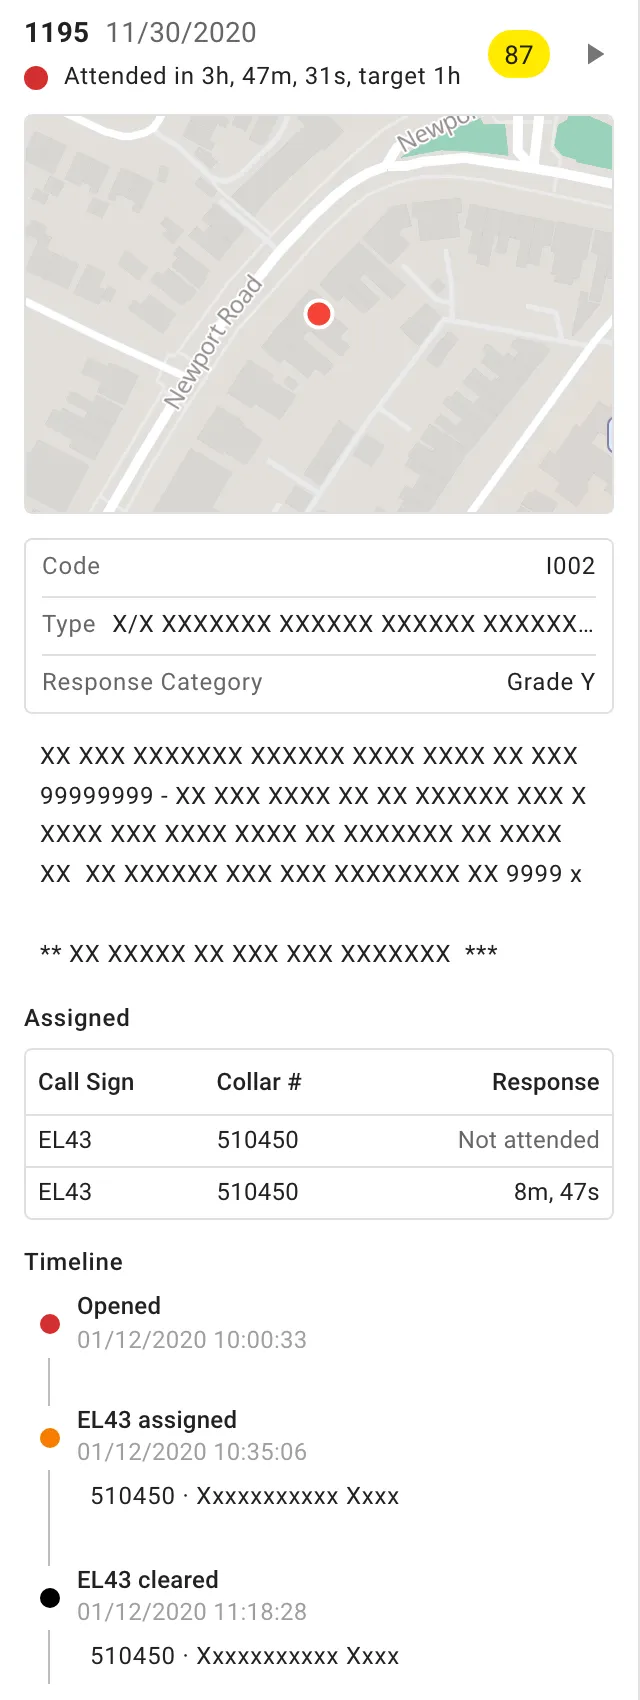
- Incidents show the same details as on the live map: type, description, response category, who responded and how quickly, and the incident’s times.
- Locations show their code, subtype and district, and the groups and areas they’re in.
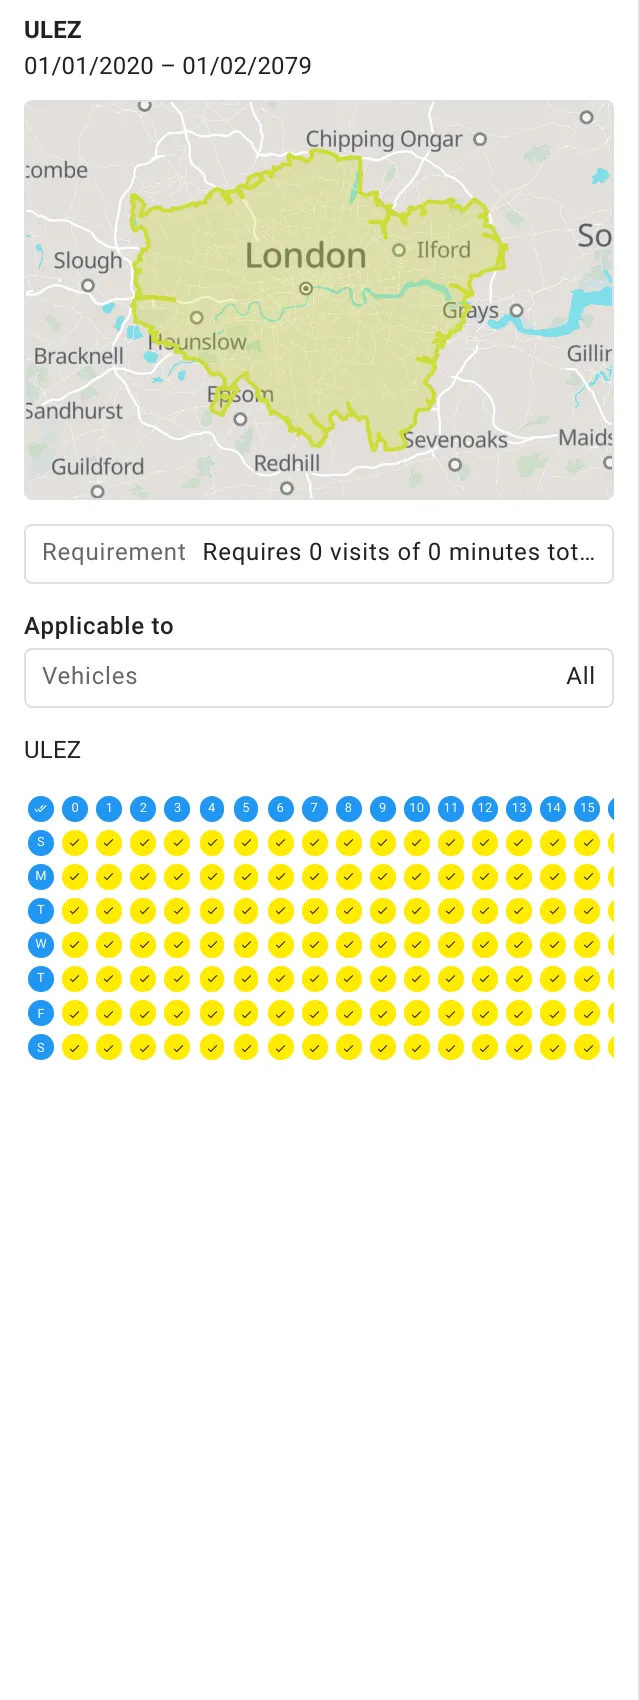
- Objectives show their type, occurrence, requirement, who they apply to, their attributes and their schedule.
- Person trails show a timeline New of what else the person did during the trail. This includes trips, idles, speed infractions, accelerometer events, incident responses, locations entered and left, double crewing and objective attendances.
- Other items show their details, then sections for the Vehicle, Driver or Person. If a driver wasn’t identified, the driver is shown as unknown.
Replay
Section titled “Replay”Select View replay in the header to open the event in Event Replay, in a new browser tab. Replay is available for:
- vehicle trips;
- vehicle and person location visits;
- person trails;
- incidents;
- accelerometer events, which replay the trip they happened on.
Stops, idles, polls and areas have no replay.
Exports
Section titled “Exports”- Vehicle trips, vehicle location visits and speed infractions: Download polls in the header downloads the vehicle’s polls for that time as CSV or GeoJSON. Each poll includes the vehicle and its driver.
- Person trails and person location visits: Download polls downloads the person’s radio polls for that time, each with the person’s name, role and collar number.
- Accelerometer events: the download button in the header downloads the event’s accelerometer readings, with speeds in mph.
Area totals
Section titled “Area totals”Open an area from an Area layer. Its header shows:
- the area’s name;
- the measure and its total, such as Vehicle Time · 5m, 43s;
- a dot in the area’s colour, showing how it ranks.
Below the header is a list of the items that make up the total New, such as the visits or incidents. It’s loaded with the layer’s time period, boundary and filters. You can search, sort and download this list like any other. Select an item to see its details.

IR3 is made by Lightbulb Analytics Ltd. © 2026