
Retrospectives
Retrospectives show what happened over a past period on a map. Each map is built from layers. A layer takes one kind of data, such as vehicle trips, incidents or person trails, from a time period and, if you like, an area. It then draws that data as shapes, bubbles, a heat map or shaded areas. You can save a retrospective and open it again later.
Typical questions a retrospective can answer:
- Where was a vehicle or person at a given time?
- Who, or which vehicles, were inside an area between two times?
- Who was driving a vehicle, and where did it go?
- Where do incidents of a certain kind happen most?
- Which areas got the most vehicle time or the most visits?
The screen at a glance
Section titled “The screen at a glance”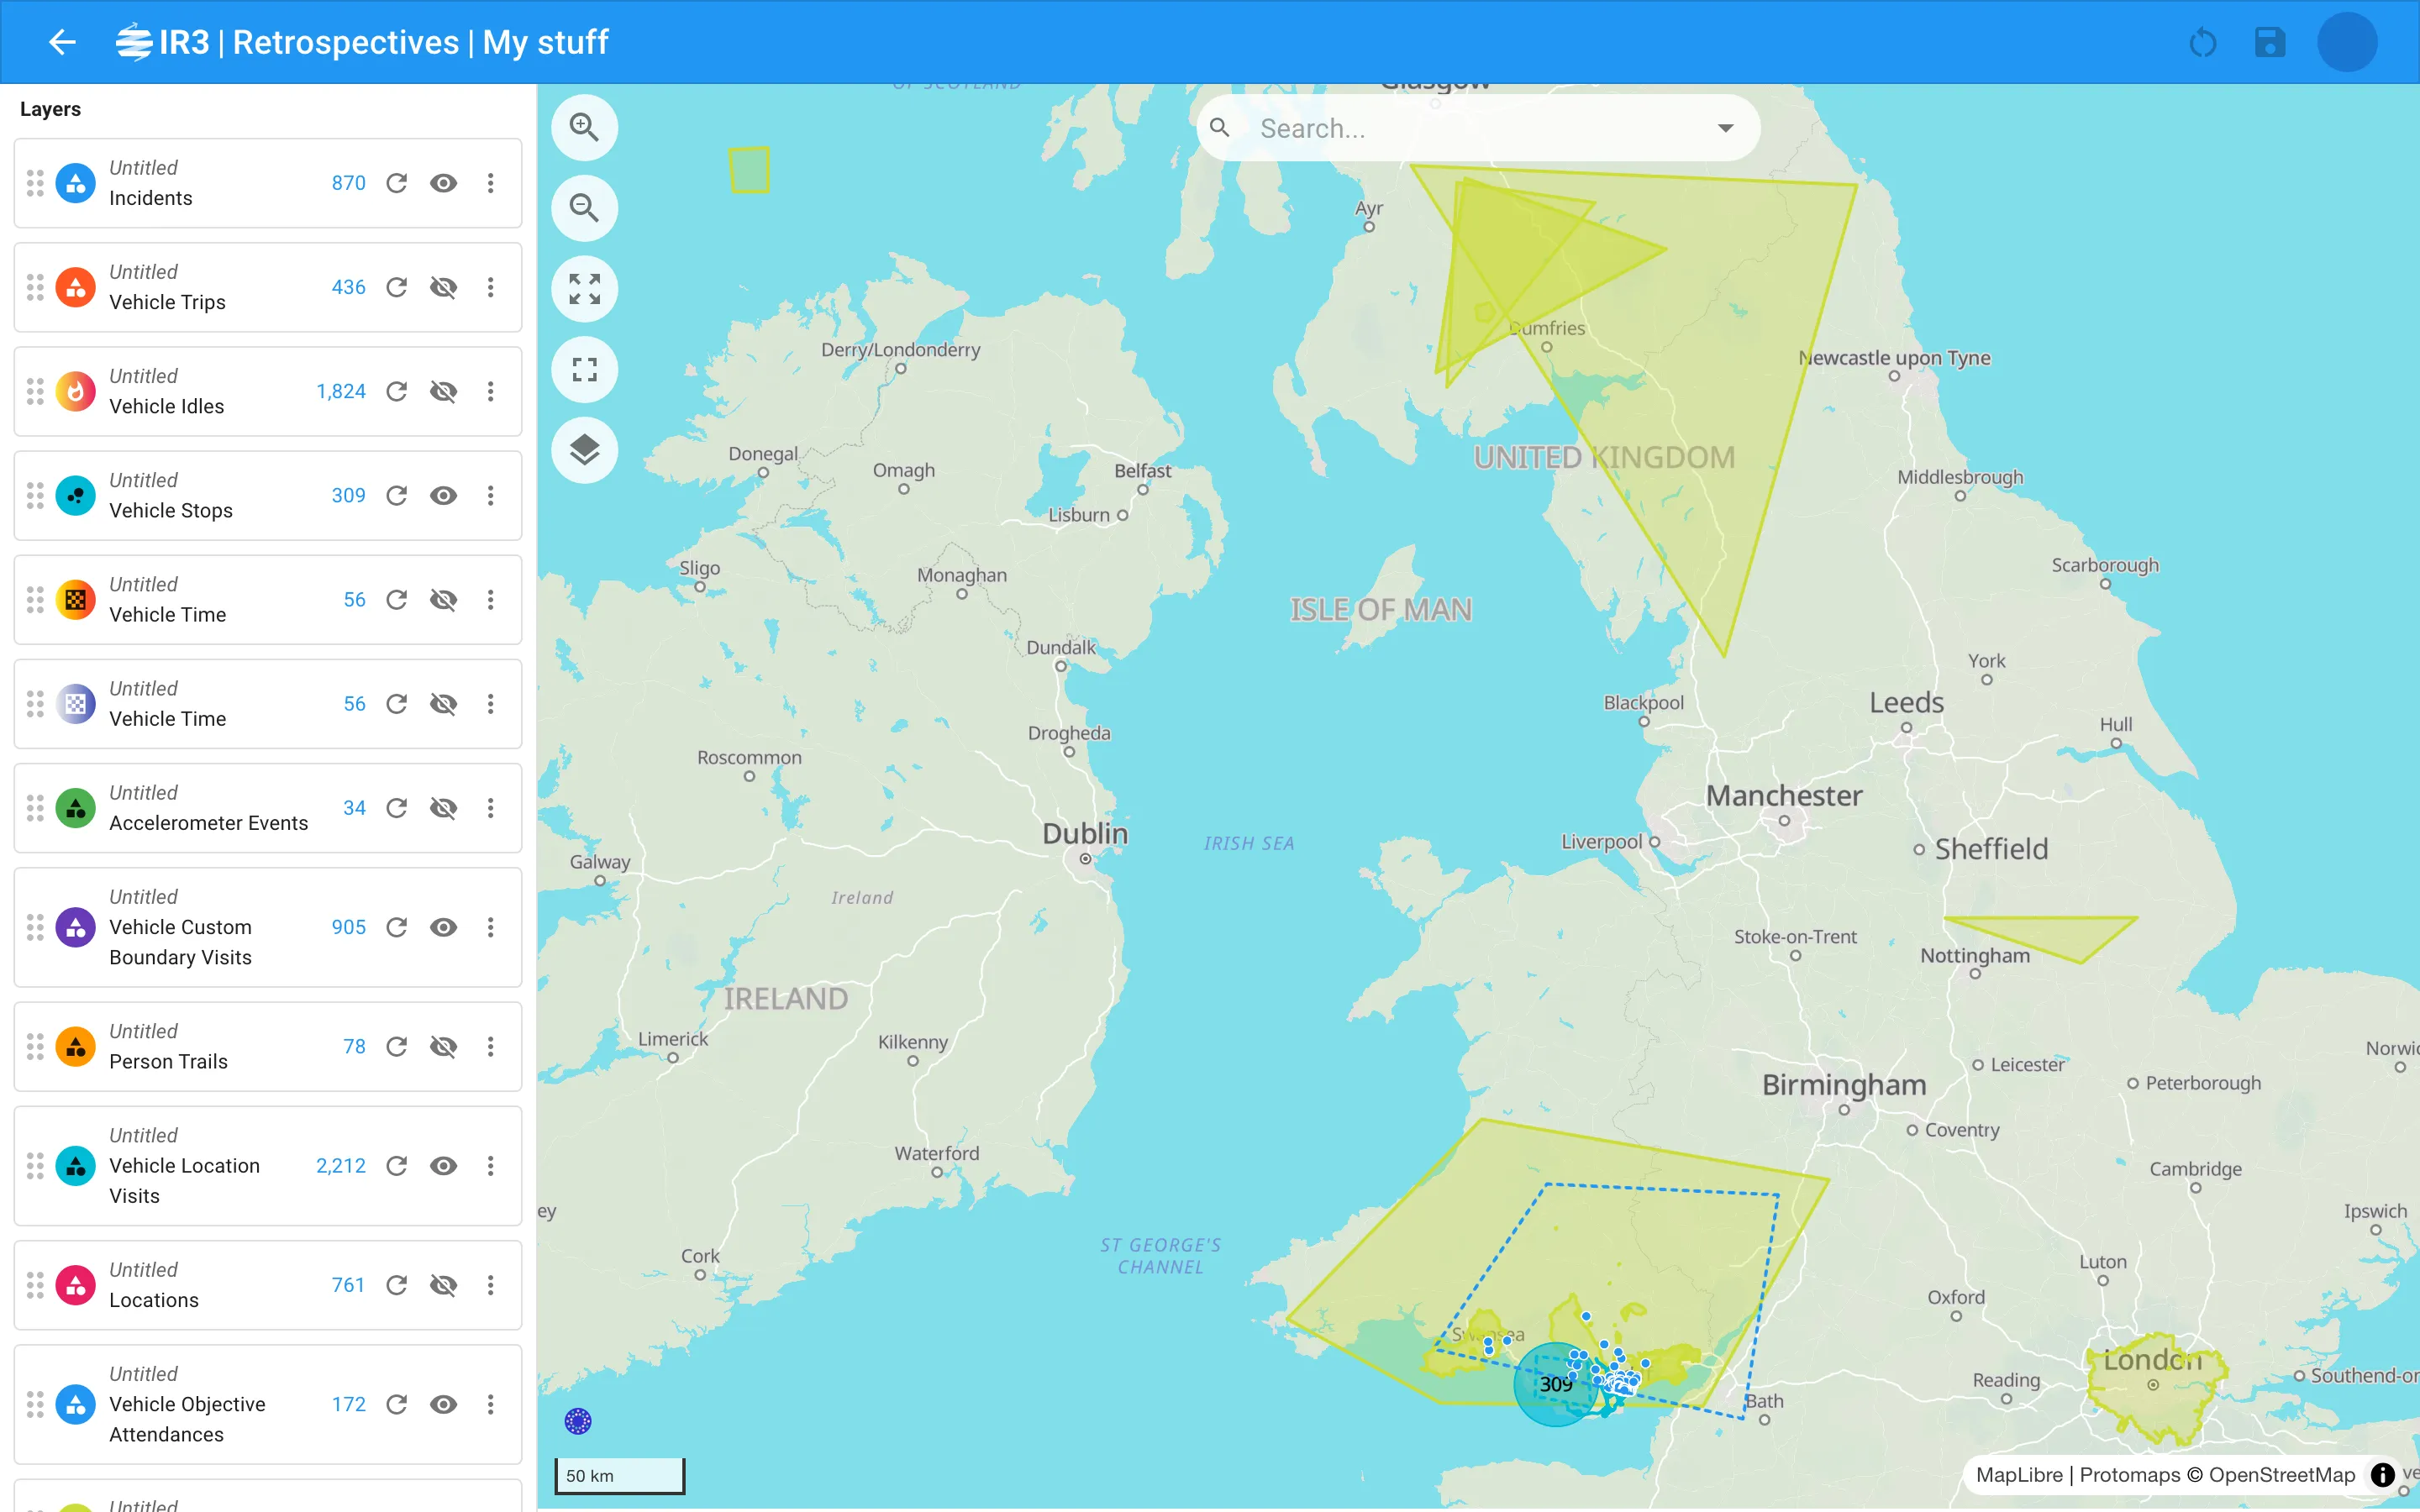
- Retrospectives in the side menu opens your saved retrospectives, shown as cards.
- Opening one shows a panel on the left and the map on the right.
- The panel lists the layers. Select a layer to see its items or change its settings, and select an item to see its details.
- The app bar shows the retrospective’s title, which you can rename, and the Reset and Save buttons.
In this section
Section titled “In this section”Saved retrospectivesFind, open, create, delete and migrate retrospectives.
The retrospective screenThe title, saving, the panel and the map controls.
LayersAdd, order, show, hide and refresh layers.
Layer settingsTypes, sources, time periods, boundaries, filters and style.
ItemsThe item list, map popups and the details of each item.
What's changedHow this version differs from the previous retrospective screen.

IR3 is made by Lightbulb Analytics Ltd. © 2026